Polarimetric fields in a developing cumulonimbus (CB) cloud on 10 August 2008
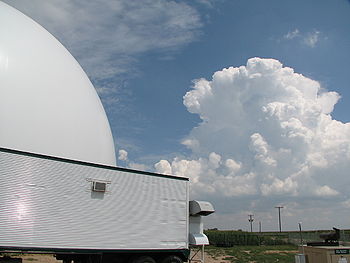
During the early afternoon hours of 10 August 2008, scattered thunderstorms began to develop in the vicinity of the CSU-CHILL radar site. General PPI volume scans indicated that positive Zdr values extended above the height of the 0 degree C temperature level in a storm that was growing just ESE of the radar. (See cloud photograph below).

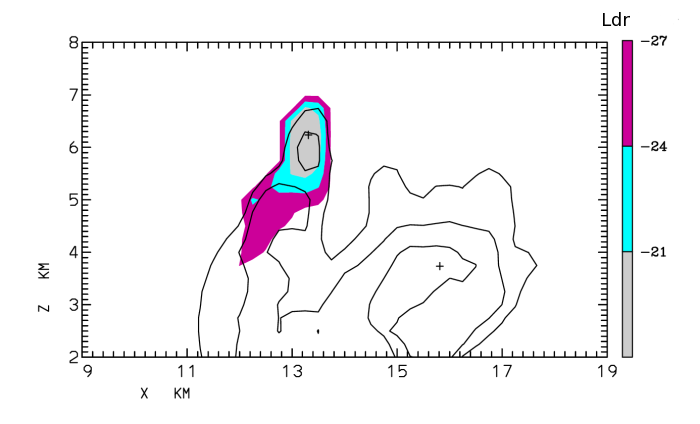
At 2001 UTC an RHI scan was done through the positive Zdr column (the RHI azimuth was 107 degrees). To generate the following contour plots, the basic polar coordinate gate data in this RHI sweep were interpolated using a Cressman weighting scheme to a Cartesian grid with points at 250m intervals in range and height; the heights are in km above mean sea level. The co-polar H reflectivity field shows that the highest echo tops were found in the nearer portion of the storm at a range of ~13 km.
 The positive Zdr column was also associated with this elevated echo summit feature. (For reference purposes, selected reflectivity contour lines have been overlaid.) Based on the Denver radiosonde data, the environmental 0 C height was around 5 km MSL.
 The largest linear depolarization levels appeared at colder temperatures at heights above the upper limits of the positive Zdr column. (Note: Ldr data is only plotted when the signal to noise ratio in the cross-polar receiver channel exceeds +10 dB). The positive Zdr values are probably generated by large, oblate supercooled drops that have been lofted above the 0 C level in a vigorous updraft. As these drops freeze, they are transformed into wet-surfaced graupel particles whose gyrating motions tend to reduce the positive Zdr magnitudes and enhance the depolarization levels. Jameson et al. (JAM 1996, p343-354) have found that the onset of cloud electrification can be associated with the appearance of these polarimetric radar graupel signatures.
