PhiDP time variability


Conceptual Summary


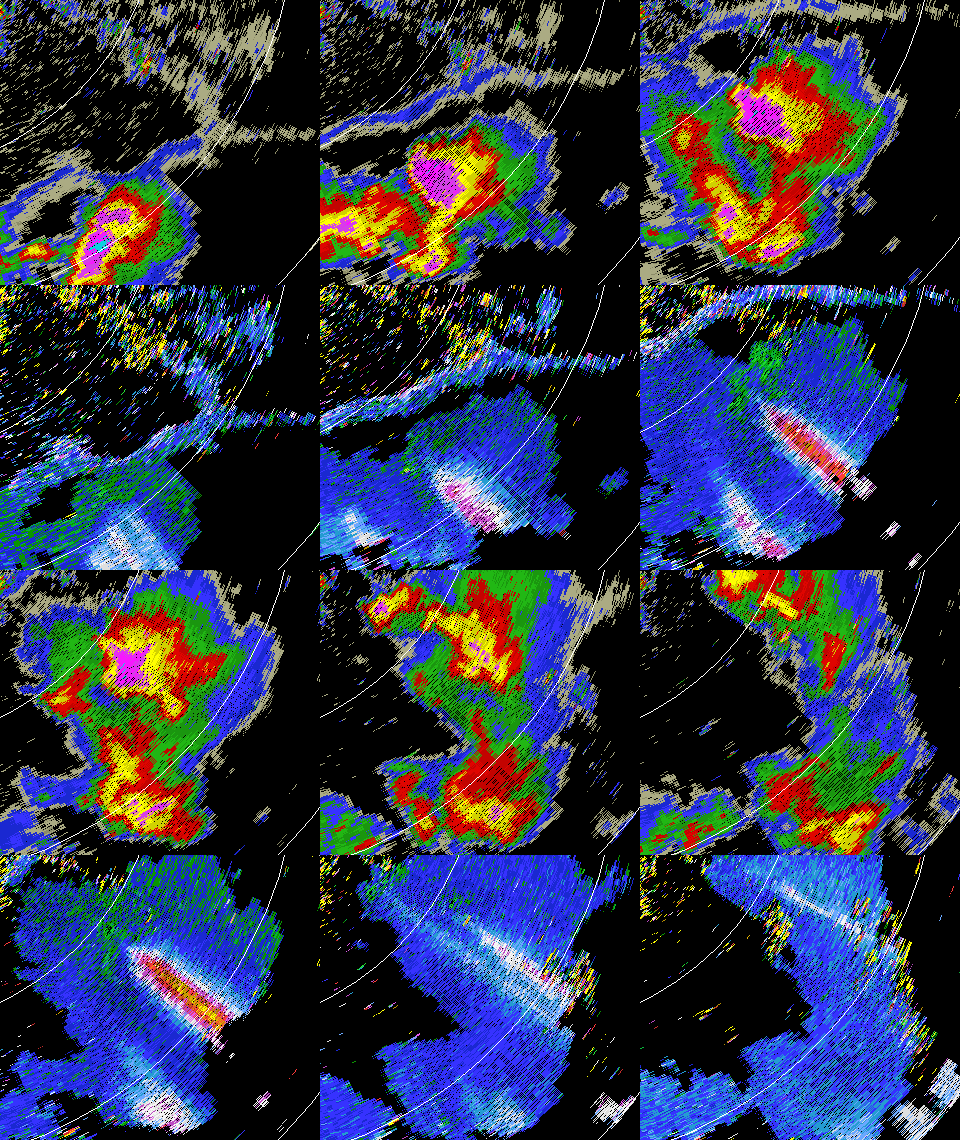
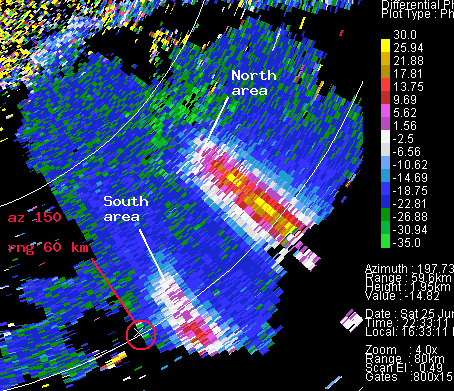
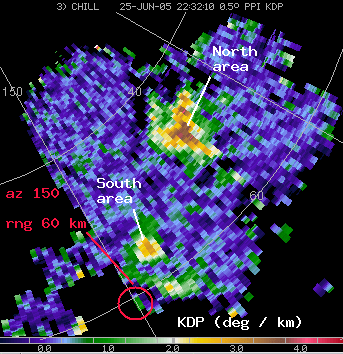
The range derivative of differential propagation phase (specific differential propagation phase (Kdp)) can be used to estimate the instantaneous rainfall rate in a way that reduces errors due to variations in raindrop size distributions. In conventional polar coordinate radar displays, regions where the plotted PhiDP values move rapidly towards larger (more positive) color scale quantities over short range intervals identify regions where the horizontally polarized return signal phase increasingly lags behind the phase of the vertically polarized return signal. This H vs. V phase shift develops when the radar pulses propagate along a path that includes significant concentrations of large, oblate raindrops. Thus, high rain rates are implied in the range intervals over which PhiDP rapidly increases (i.e., Kdp is positive). The above animated image sequence was made from a series of 0.5 degree elevation PPI scans made at essentially four minute intervals. The evolution of the echo cores can be seen in the reflectivity image series. The associated large phase shift areas also undergo appreciable evolution even on this short time scale. Shown at right are single frame images of a PhiDP field and the associated Kdp values that were taken from the time period covered in the animation loop. In agreement with the color scale variations in the basic PhiDP data, Kdp values exceed ~3 deg / km in the northern phase shift region. The Kdp values are somewhat smaller in the southern region where PhiDP variation with increasing range is less.
VCHILL
Main article: VCHILL
References
- Zrnic, D. S., and A. V. Ryzhkov, 1996: Advantages of rain measurements using specific differential phase. J. Atmos. Oceanic Technol., 13, 454-464.