ASP lab evolution and response case 7 July 2008
Introduction
Convective precipitation can undergo fairly rapid time evolution, as a result the associated polarimetric radar signatures can change significantly from volume scan to volume scan. The data shown in this example were collected while relatively low elevation PPI sector scans were being done for rainfall mapping purposes during the afternoon hours of 7 July 2008.
2145:23 radial velocity
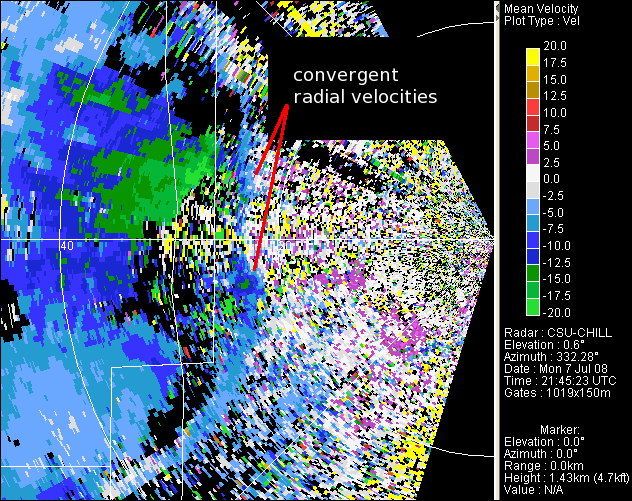
Earlier thunderstorm activity over the foothills of the Rocky Mountains had generated an outflow boundary that was moving eastward. In the following image, the velocity scale limits used in the VCHILL color table have been reduced to +/- 20 mps to more clearly reveal the modest velocity magnitudes. The strongest inbound velocities along the fine line at the leading edge of the outflow are seen along the CSU-CHILL 260 degree radial. Ahead of the line, lighter away (positive) velocities exist in the widespread boundary layer echo.
2145:23 Zdr
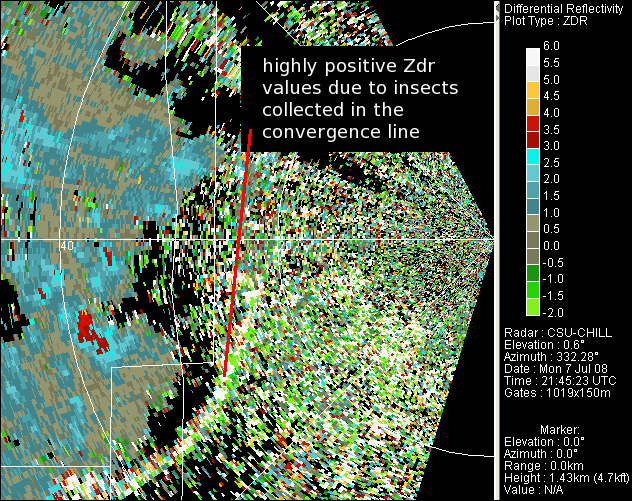
Much of the boundary layer echo has highly positive (maximums ~5 - 6 dB) Zdr values. (In contrast, note that the Zdr values in the rain area near the 40 km range ring are generally below +4 dB). Polarimetric radars frequently observe this surface-based, highly positive boundary layer echo pattern during the warm season when appreciable insect concentrations exist. The low level outflow from the foothills storms has swept most of the insects away from the immediate vicinity of the precipitation and collected them along the leading edge of the outflow. The organization of Zdr patterns in the "clear air" boundary layer, including both local maxima and echo-free swept out areas, can help identify low level convergence areas near which new convection may develop.
Two-sweep reflectivity loop from the same volume scan
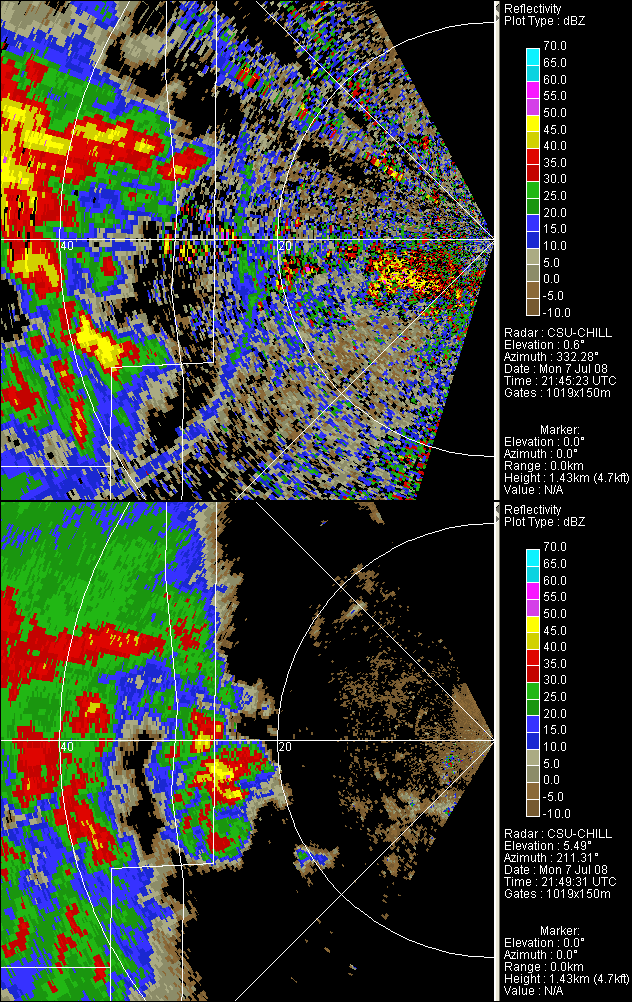
An indication of the evolving echo situation can be seen in the following two frame reflectivity loop. One frame is from the same 0.6 degree PPI sweep shown in the preceeding radial velocity and Zdr discussions. The second frame is from the 5.5 degree PPI sweep that was completed at 2149:31 UTC. While essentially no precipitation is evident at the lower elevation, areas of 40 - 45 dBZ echo are detected in the 4.5 degree PPI sweep just behind the outflow boundary.
2151:15 Zdr and phidp
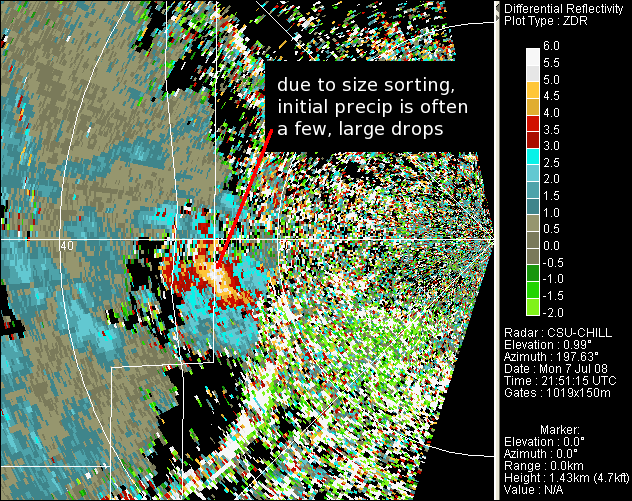
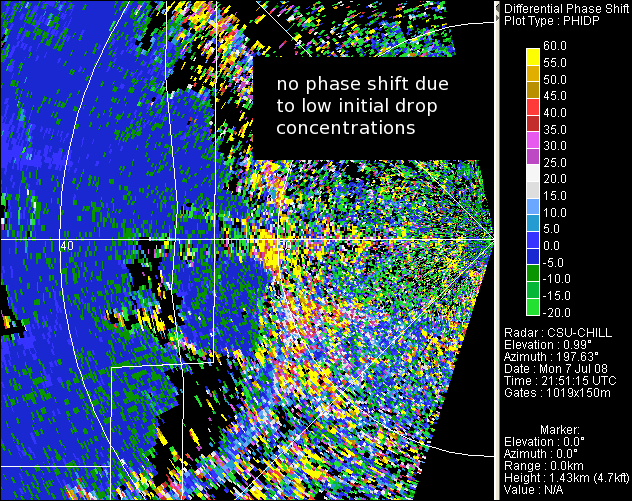
During the next volume scan, precipitation was first detected in the 1 degree PPI sweep that ended at 2151:15. The precipition that initially approaches the surface often contains only the largest, highest fallspeed particles. Here, these large, oblate drops produce distinctly positive Zdr values, but their concentrations are not enough to generate a significant differential propagation phase shift at this time.
2156:36 Zdr and phidp
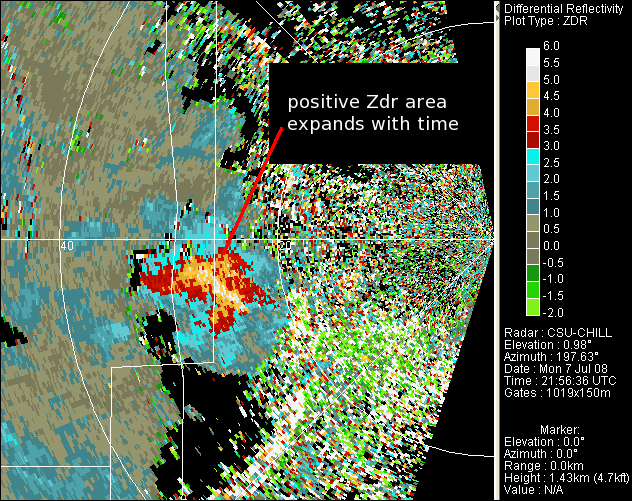
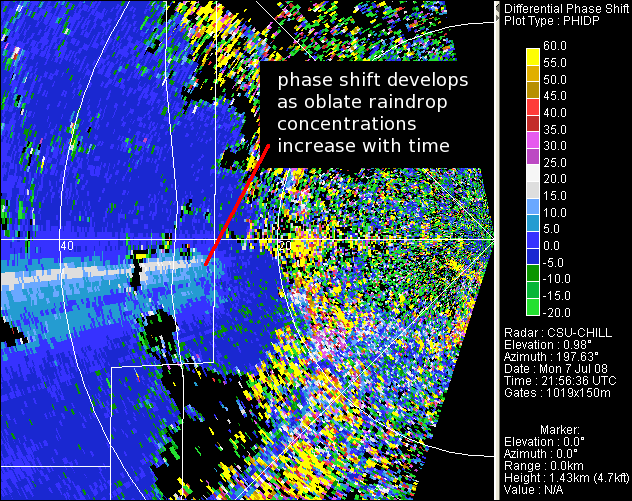
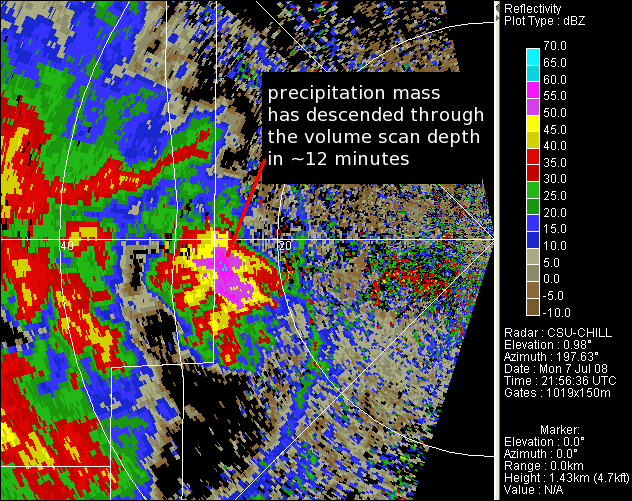
In the next volume scan, the positive Zdr's associated with the developing precipitation shaft expand in area. As the drop size distribution broadens into a more normal size spectrum, the phidp color shift pattern associated with significant precipitation rates begins to appear. (Since Zdr is sensitive to the aspect ratios of the largest (highest reflectivity) particles, it undergoes little change as the smaller diameter / higher concentration portion of the drop size distribution fills in with time.) The reflectivity field now shows an echo core reaching values of 50 - 60 dBZ at 2156:36. In the two-frame reflectivity loop, this area was free of precipitation at 2145:23.
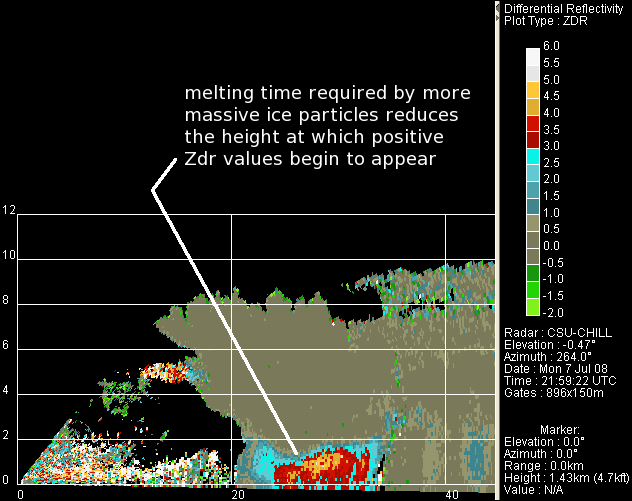
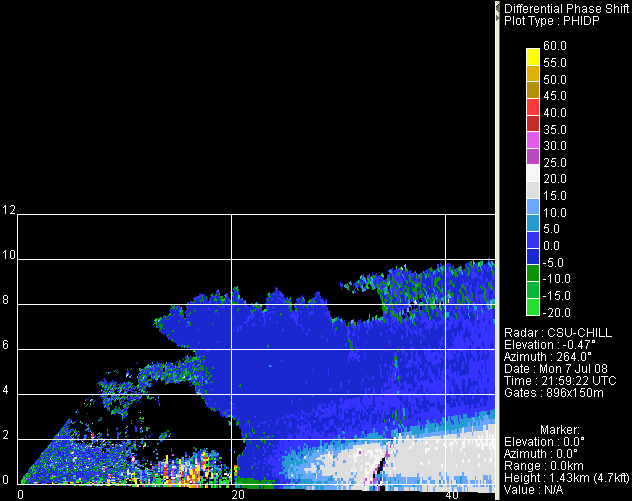
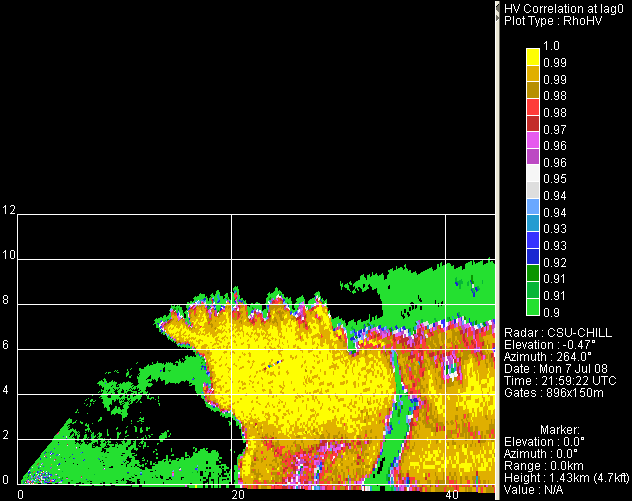
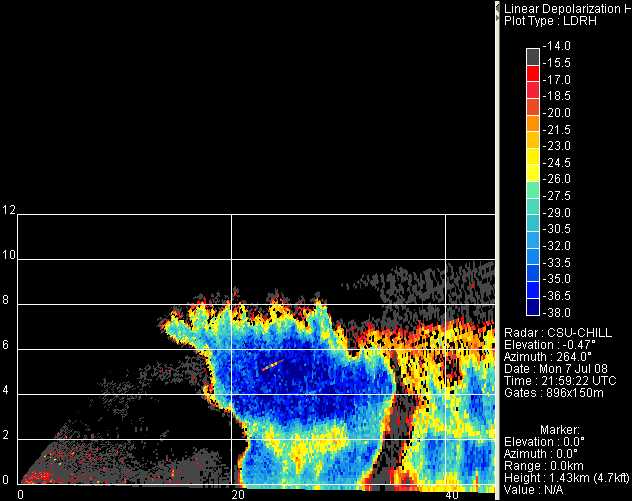
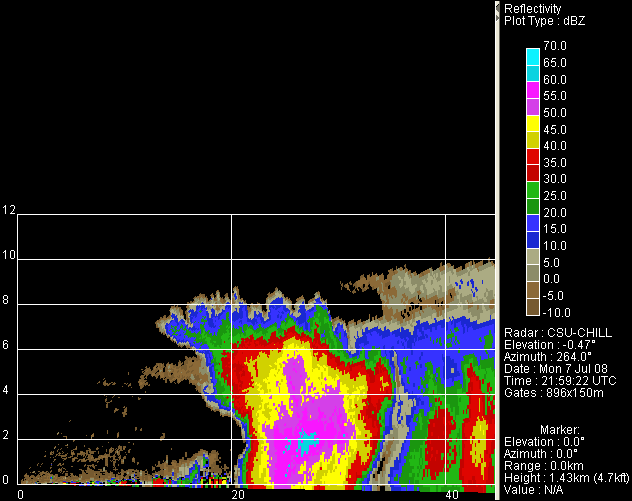
2159:22 RHI Volume
An RHI sweep through the echo core ~3 minutes later reveals several of the "textbook" polarimetric radar patterns presented in the earlier tutorial bookmark.
Assignment
Examine the 7 July 2008 2155:17 volume with VCHILL. Adjust the display centering, zoom level and color scales to present data from the descending precipitation shaft described above. Save 4 images that you feel convey important aspects of the microphysical situation as remotely sensed by a polarimetric radar.
To save the VCHILL images, right click in the data window of interest and select "save image". Once you have saved all of your desired images, select the "file" tab at the upper left end of the VCHILL upper task bar. On the file menu, select "saved image browser". A new window will open with navigation buttons at the bottom that let you move through the various saved images. Use the "image to file" button to export a saved display window as a png or gif file.
Compose a short text description of your images and e-mail it to the asp@chill.colostate.edu. Attach your image files and use a subject line of "7 July 2008".
