Template:Featured Image/October, 2014: Difference between revisions
From CSU-CHILL
Pat kennedy (talk | contribs) (Initial posting) |
Pat kennedy (talk | contribs) (wording correction) |
||
| Line 1: | Line 1: | ||
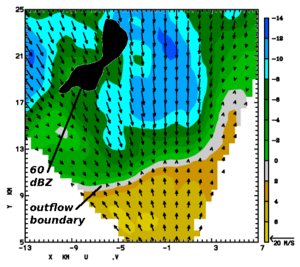
{{POTM|image=27jun2014 1.5 velvect web anot.png|200px|title=Radial velocities near an outflow boundary|credit=Patrick Kennedy|text=CSU-CHILL PPI sector scan at 1.5 deg elevation angle at 2032 UTC on 27 June 2014. Solid black fill depicts the 60 dBZ echo core location. Radial velocities are shown as both a color fill and as radially-oriented vectors. Convergence is | {{POTM|image=27jun2014 1.5 velvect web anot.png|200px|title=Radial velocities near an outflow boundary|credit=Patrick Kennedy|text=CSU-CHILL PPI sector scan at 1.5 deg elevation angle at 2032 UTC on 27 June 2014. Solid black fill depicts the 60 dBZ echo core location. Radial velocities are shown as both a color fill and as radially-oriented vectors. Convergence is implied along the outflow boundary that had propagated ahead of the echo core.}} | ||
Latest revision as of 09:18, 1 October 2014

|
Radial velocities near an outflow boundary CSU-CHILL PPI sector scan at 1.5 deg elevation angle at 2032 UTC on 27 June 2014. Solid black fill depicts the 60 dBZ echo core location. Radial velocities are shown as both a color fill and as radially-oriented vectors. Convergence is implied along the outflow boundary that had propagated ahead of the echo core. Photo credit: Patrick Kennedy |