Real-time Display: Difference between revisions
(→Download and Install from CVS: Updated installation instructions) |
(Updated required libraries and Main Window section) |
||
| Line 1: | Line 1: | ||
The CHILL | The CHILL Real-time Display is a radar visualization tool for Linux, which allows the radar variables generated by the signal processor to be viewed in real-time in a variety of ways. The display communicates via the VCHILL protocol to the signal processor. The processor sends beam-by-beam data to the display. Scan conversion of the incoming data from polar (r-θ) to Cartesian coordinates is done using an algorithm that is guaranteed to not generate "holes" in the display, while not producing overdraw. Users can interactively zoom and pan the display while maintaining high update rates. External GIS mapping tools are used to generate a base map and an overlay. Display read-outs provide numeric information. Annotations provide at-a-glance information about the radar operating state. | ||
==Main Window== | ==Main Window== | ||
The | The main control window of the display program is subdivided into tabs. | ||
===Available Fields=== | |||
[[Image:rtdisp_mainwindow.png|Real-time Display Main Window|thumb|right]] | |||
This tab lists all available fields from the moment server, along with their minimum and maximum values. PPI/RHI displays or A-scope windows can be launched from here by clicking on the appropriate checkbox. In the figure, the Reflectivity PPI/RHI display has been opened by clicking the checkbox. The user may adjust lower and upper limits of the displayed data using the Min/Max columns - click the number to show an editor where the new limts may be entered. | |||
The Field, Units and Description columns are purely informational and cannot be updated. | |||
===Transmitters=== | |||
This tab shows a time history of transmitter power, and a summary of the transmitter operating state. It is intended as a quick monitor of transmitter status. | |||
===Layers=== | |||
This tab permits the transparency of individual layers presented in the display program to be modified. The default background color of the windows (where the base map data is transparent) may also be changed. | |||
===Tracks=== | |||
Lists information about aircraft tracks, if available from the signal processor. One track may be highlighted for closer examination, and track histories may be cleared. | |||
==Display Windows== | ==Display Windows== | ||
| Line 97: | Line 112: | ||
==Downloading== | ==Downloading== | ||
===Required Libraries=== | ===Required Libraries=== | ||
This section lists the libraries required to build the display program. Note that the steps given work only for distributions such as Fedora Core that use the Yellowdog Update Manager (YUM). Please refer to your Linux distribution's documentation for similar instructions for other distributions. | This section lists the libraries required to build the display program. Note that the steps given work only for distributions such as Fedora Core that use the Yellowdog Update Manager (YUM). Please refer to your Linux distribution's documentation for similar instructions for other distributions. | ||
<center> | |||
{| {{Prettytable}} | |||
!{{Hl3}} | Package | |||
!{{Hl3}} | RPM name | |||
!{{Hl3}} | Minimum version | |||
!{{Hl3}} | Description | |||
|- | |||
|[http://live.gnome.org/GTK%2B GTK 2.0] | |||
|gtk2-devel | |||
|2.14 | |||
|Windowing toolkit | |||
|- | |||
|[http://live.gnome.org/GNetLibrary GNet 2.0] | |||
|gnet2-devel | |||
|2.0.8 | |||
|Networking layer for glib | |||
|- | |||
|[http://www.jamesh.id.au/software/libglade/ Libglade 2.0] | |||
|libglade2-devel | |||
|2.6 | |||
|Helper library for widget/window creation | |||
|- | |||
|[http://curl.haxx.se/libcurl/ LibCURL] | |||
|curl-devel | |||
|6.0 | |||
|File transfer library | |||
|- | |||
|[http://sourceforge.net/projects/gtkdatabox/ GTKDataBox] | |||
|gtkdatabox-devel | |||
|0.9 | |||
|Graph visualization package | |||
|- | |||
|[http://www.xmlsoft.org/ LibXML] | |||
|libxml | |||
|2.0 | |||
|XML Parser | |||
|} | |||
</center> | |||
You can install these packages with the following commands as root: | |||
# yum -y install curl-devel gtkdatabox-devel | # yum -y install gtk2-devel gnet2-devel libglade2-devel | ||
# yum -y install curl-devel gtkdatabox-devel libxml-2.0 | |||
===Required Tools=== | ===Required Tools=== | ||
| Line 114: | Line 165: | ||
# yum -y install gcc automake autoconf libtoolize | # yum -y install gcc automake autoconf libtoolize | ||
git (version control system - required if using the git installation method, see below) | |||
# yum -y install | # yum -y install git | ||
===Installation=== | ===Installation=== | ||
Revision as of 19:22, 9 August 2010
The CHILL Real-time Display is a radar visualization tool for Linux, which allows the radar variables generated by the signal processor to be viewed in real-time in a variety of ways. The display communicates via the VCHILL protocol to the signal processor. The processor sends beam-by-beam data to the display. Scan conversion of the incoming data from polar (r-θ) to Cartesian coordinates is done using an algorithm that is guaranteed to not generate "holes" in the display, while not producing overdraw. Users can interactively zoom and pan the display while maintaining high update rates. External GIS mapping tools are used to generate a base map and an overlay. Display read-outs provide numeric information. Annotations provide at-a-glance information about the radar operating state.
Main Window
The main control window of the display program is subdivided into tabs.
Available Fields

This tab lists all available fields from the moment server, along with their minimum and maximum values. PPI/RHI displays or A-scope windows can be launched from here by clicking on the appropriate checkbox. In the figure, the Reflectivity PPI/RHI display has been opened by clicking the checkbox. The user may adjust lower and upper limits of the displayed data using the Min/Max columns - click the number to show an editor where the new limts may be entered.
The Field, Units and Description columns are purely informational and cannot be updated.
Transmitters
This tab shows a time history of transmitter power, and a summary of the transmitter operating state. It is intended as a quick monitor of transmitter status.
Layers
This tab permits the transparency of individual layers presented in the display program to be modified. The default background color of the windows (where the base map data is transparent) may also be changed.
Tracks
Lists information about aircraft tracks, if available from the signal processor. One track may be highlighted for closer examination, and track histories may be cleared.
Display Windows
PPI Window

The Plan Position Indicator (PPI) display shows a range vs. azimuth display. Color values indicate the variable value at each point. The data is underlayed by a basemap, which indicates selected highways, geographic features, county lines, etc. Several basemaps are available, these may be picked from a webserver or from local disk files. Also shown is an overlay consisting of radials and range rings, along with an overlay map, indicating local landmarks such as towns and cities. Each of these features may be disabled or partially made transparent.
On the right side, an annotation pane is shown. This resizable pane shows operating statistics of the radar and the color scale. Important parameters such as polarization mode, transmitter power, date and time are shown here.
Along the bottom, the marker and cursor position and values are shown. The marker is positioned by clicking on the map. The cursor represents the value under the current mouse position. Also shown are the antenna position and the current scan name which the radar is executing.
Zooming is done by drawing a bandbox around the region to be zoomed. The display automatically picks the correct scale factor and center point to highlight the chosen area. The display center can also be set using the mouse. This allows the user to peruse the current scan as it arrives from the radar.
The display also shows a histogram of the values within the current display window. This may be used to get quick estimates of bias, etc.

RHI Window

The Range-Height Indicator (RHI) display shows the radar data in a range vs. height display. It is used when the radar executes vertical scans. Similar to the PPI mode, color indicates the variable value at that point. No base map is shown in this case, however, range rings and radials are shown as an overlay over the data.
Most features of the PPI display, such as zooming and panning are maintained in the RHI display. In addition, the height axis may be scaled differently from the range axis, this allows the vertical structure of storms to be more carefully examined. The height displayed is corrected for a curved earth model, and also takes into account the standard atmospheric model for height correction with range. If desired, this behavior may be turned off.
A-scope Window

The A-scope shows a range profile of the selected variable from the signal processor. It is useful for measuring range trends. The a-scope has two operating modes, a realtime mode and a fixed mode. In realtime mode, the a-scope updates itself each time a new ray arrives from the signal processor. This gives a continuously updating waveform on screen, which is useful for diagnosis and when the antenna is in fixed-pointing mode. Unlike the standalone A-scope program, this program requires a functioning signal processor to function. It only sees the processed moments, and hence cannot display spectra of range gates, etc.
In the fixed mode, the display shows the range profile at the marker position on a corresponding PPI or RHI view. This allows range profiles at various locations to be examined.
The a-scope allows the user to zoom and pan the display using the mouse. Zooming is done by drawing a bandbox of the region to zoom. Once zoomed, the display scrollbars become active and allow the display to be panned in either axis.
A cursor and marker are available in the a-scope. The marker is synchronized with the marker in the PPI/RHI displays, and is shown on the a-scope as a dashed line. The cursor position is shown as a triangle with the corresponding range and value underneath. The value at the marker and cursor is shown on the status bar on the bottom of the a-scope.
Post processing options are available to the user in the form of smoothing. Three types of smoothing are available, as shown in the table below.
| Method | Features |
|---|---|
| None | No smoothing applied |
| 3x Averaging | Average of current gate with adjacent ones |
| 5x Averaging | Average of gate with two adjacent ones |
| 5x FIR | A simple FIR filter is applied to the two gates surrounding each gate. |
Smoothing options
The display program offers several modes to smooth the input data before display in the PPI and RHI modes. The options are listed in the table below.
| Method | Features |
|---|---|
| None | No smoothing applied |
| 1D Mean | Pixel is average of adjacent range gates |
| 2D Mean | Pixel is average of adjacent range gates and azimuths |
| 1D Median | Pixel is the median of adjacent range gates |
| 2D Median | Pixel is the median of adjacent range gates and azimuths |
The mean filters perform simple smoothing, they tend to reduce the variance of the fields due to averaging. They do not attenuate speckle noise seen due to interference, birds, aircraft, etc. Median filters are good at removing speckle noise, but do not reduce the variance as much as the mean filters.
Alpha Thresholding

The display program makes use of alpha-blending to implement thresholding. This means that the thresholding need not be an on-off action. Gradual slopes of any arbitrary shape can be programmed in through the alpha editor. Conventional thresholding can be emulated by drawing thresholding function in the alpha editor. This method of thresholding improves the visual quality of the result, since thresholded edges appear smoother than with conventional thresholding schemes.
Color Map Editor
Several color maps are available, these can be selected using the Color Map Editor. Each Color Map has several color tables which can be associated with a particular field. The field assignments are done in the Color Map Editor, while the color tables themselves are edited in the Color Table Editor.
-
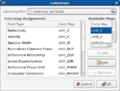
Engineering Display Color Map Editor
-
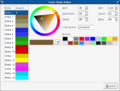
Engineering Display Color Table Editor


Downloading
Required Libraries
This section lists the libraries required to build the display program. Note that the steps given work only for distributions such as Fedora Core that use the Yellowdog Update Manager (YUM). Please refer to your Linux distribution's documentation for similar instructions for other distributions.
| Package | RPM name | Minimum version | Description |
|---|---|---|---|
| GTK 2.0 | gtk2-devel | 2.14 | Windowing toolkit |
| GNet 2.0 | gnet2-devel | 2.0.8 | Networking layer for glib |
| Libglade 2.0 | libglade2-devel | 2.6 | Helper library for widget/window creation |
| LibCURL | curl-devel | 6.0 | File transfer library |
| GTKDataBox | gtkdatabox-devel | 0.9 | Graph visualization package |
| LibXML | libxml | 2.0 | XML Parser |
You can install these packages with the following commands as root:
# yum -y install gtk2-devel gnet2-devel libglade2-devel
# yum -y install curl-devel gtkdatabox-devel libxml-2.0
Required Tools
This is a list of tools required to build the software. Again, the install steps work only for YUM based distributions
gcc (C compiler), automake, libtoolize and autoconf (build tools)
# yum -y install gcc automake autoconf libtoolize
git (version control system - required if using the git installation method, see below)
# yum -y install git
Installation
The real-time display is a part of the CDP signal processing suite, which is available on request as a tarball or via git.
Using a tarball
Extract the tarball to a working directory.
$ tar zxf cdp.tar.gz
Change directories to the display program and execute the build steps.
$ cd cdp/gtk_display
$ ./autogen.sh
$ make
Installing the program (must be root for default install target, which is /usr/local)
# make install
Using git
Clone the cdp git repository to a working directory on your machine, by following the instructions here. The remaining steps should be the same as above.
Running the program
You can run the program from the working directory
$ cd cdp/gtk_display/src
$ ./gtk_display
Once the installation step described above is completed, you can run it from anywhere:
$ gtk_display
If installed as root, entries will be created under your window manager menus (if available). On Fedora and derived distributions, this is under Applications->Other->GTK Display.