RHI scans through thunderstorm and snow echoes: Difference between revisions
Pat kennedy (talk | contribs) No edit summary |
Pat kennedy (talk | contribs) No edit summary |
||
| Line 10: | Line 10: | ||
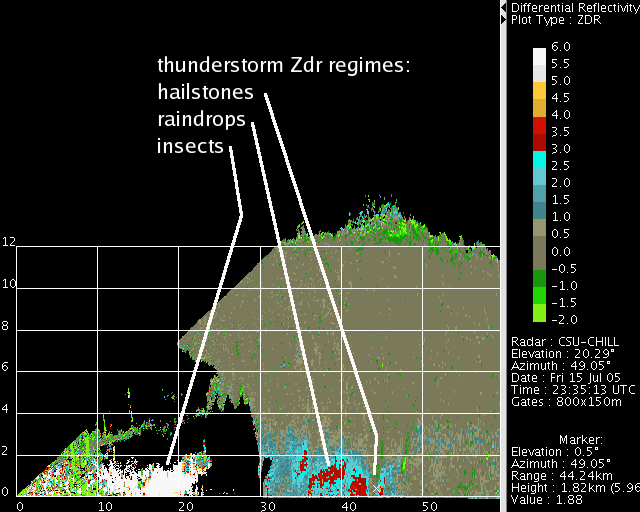
The differential reflectivity measurement made by dual polarization radars characterizes the reflectivity-weighted mean axis ratio of the scatterers. In this thunderstorm example, the most positive Zdr values (i.e., the most flattened particle shapes) are found in the echoes from the insects that have been concentrated by the convergent airflow along the fine line. Moderate (+2 to +3 dB) Zdr values are found where flattened raindrops exist. Near 0 dB Zdr's (i.e., equal power returns from the horizontally and vertically-polarized radar pulses) are seen from the randomly-oriented hailstones within the highest-reflectivity part of the precipitation shaft. These ~0dB Zdr values also exist through most of the sub-freezing depth of the thunderstorm. Thus, most of the Zdr field patterns in this example are also confined to the relatively near-surface height layer. | The differential reflectivity measurement made by dual polarization radars characterizes the reflectivity-weighted mean axis ratio of the scatterers. In this thunderstorm example, the most positive Zdr values (i.e., the most flattened particle shapes) are found in the echoes from the insects that have been concentrated by the convergent airflow along the fine line. Moderate (+2 to +3 dB) Zdr values are found where flattened raindrops exist. Near 0 dB Zdr's (i.e., equal power returns from the horizontally and vertically-polarized radar pulses) are seen from the randomly-oriented hailstones within the highest-reflectivity part of the precipitation shaft. These ~0dB Zdr values also exist through most of the sub-freezing depth of the thunderstorm. Thus, most of the Zdr field patterns in this example are also confined to the relatively near-surface height layer. | ||
[[Image:Outflow_zdr_anot.png]] | [[Image:Outflow_zdr_anot.png]] | ||
Snow-producing echo systems are also frequently relatively shallow. The following slow scan rate RHI was taken along the axis of a snow band that was passing over the CSU-CHILL radar site near Greeley, Colorado. (The vertical height scale is the same as that used in the thunderstorm case shown above. The color scale limits have been changed due to the narrower range of reflectivity values.) | |||
[[Image:Y_snow_Z_anot.png]] | |||
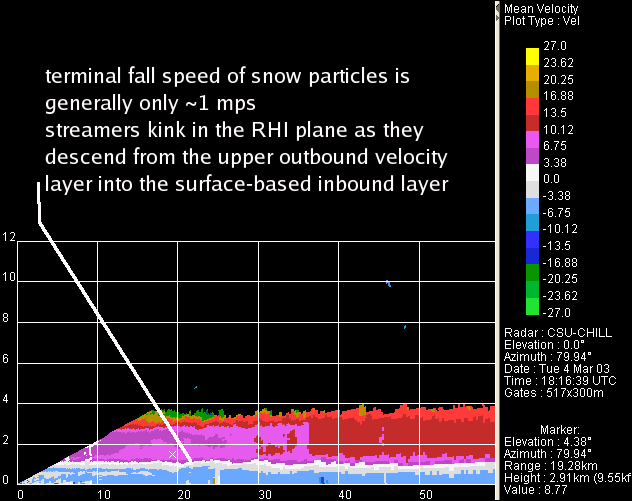
The "kinked" reflectivity profiles are due to the marked variation of the wind field in the vertical. Inbound (negative) radial velocities are found in the surface-based layer. (This "upslope" flow pattern is favorable for the development of precipitation in eastern Colorado). Above the surface layer, positive (outbound) radial velocities exist. The "snow streamers" become curved as the precipitation particles descend through this changing wind field. Due to these sloping trajectories, echo locations observed at longer radar ranges may not accurately indicate where the highest reflectivity areas are located at the surface. | |||
[[Image:Y_snow_V_anot.png]] | |||
Revision as of 11:29, 8 April 2008
Many operationally significant echo features exist within the lowest ~2km layer of the atmosphere. Under typical propagation conditions, the microwave pulses transmitted by meteorological radars will not follow the curvature of the Earth. Thus, the height of the center of the radar's beampath will increase with range, leaving the near-surface layer unobserved at longer ranges. (This basic limitation applies to both conventional single polarization as well as polarimetric weather radars.)
Some implications of this can be seen in the following annotated RHI scans through a thunderstorm:
The fine line echo marking the leading edge of the outflow is confined to the lowest height levels-
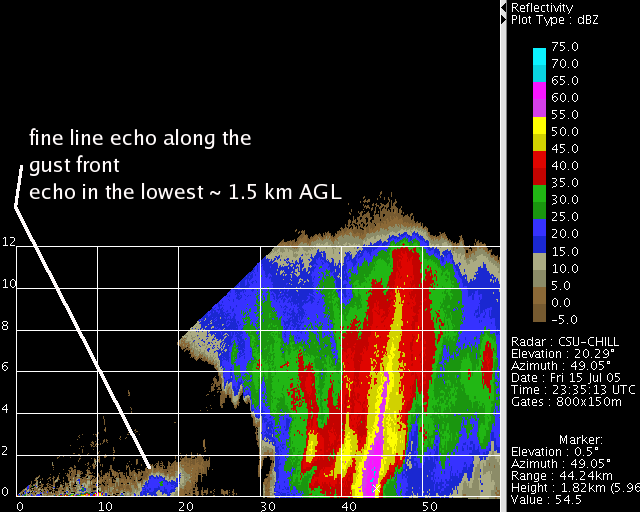
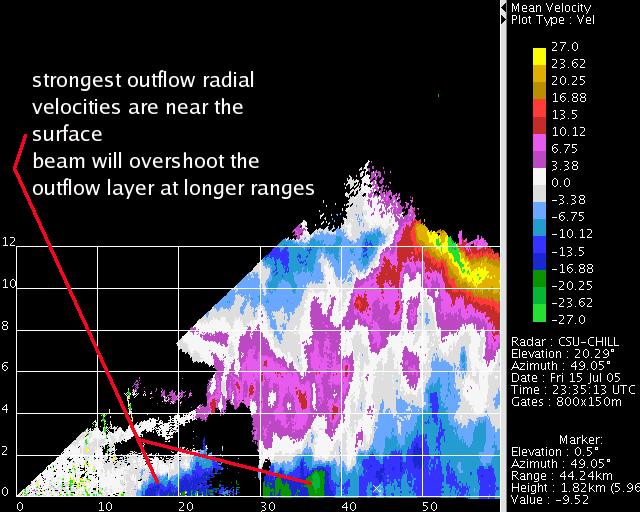
Due to its relatively high density, the cold air outflow from the storm maximizes near the ground. These shallow, strong outflows can seriously impact aircraft takeoff and landing operations. To improve their detection, the FAA Terminal Doppler Weather Radar systems are installed at fairly close ranges (within roughly 20 km) to the airports that they are protecting.
The differential reflectivity measurement made by dual polarization radars characterizes the reflectivity-weighted mean axis ratio of the scatterers. In this thunderstorm example, the most positive Zdr values (i.e., the most flattened particle shapes) are found in the echoes from the insects that have been concentrated by the convergent airflow along the fine line. Moderate (+2 to +3 dB) Zdr values are found where flattened raindrops exist. Near 0 dB Zdr's (i.e., equal power returns from the horizontally and vertically-polarized radar pulses) are seen from the randomly-oriented hailstones within the highest-reflectivity part of the precipitation shaft. These ~0dB Zdr values also exist through most of the sub-freezing depth of the thunderstorm. Thus, most of the Zdr field patterns in this example are also confined to the relatively near-surface height layer.
Snow-producing echo systems are also frequently relatively shallow. The following slow scan rate RHI was taken along the axis of a snow band that was passing over the CSU-CHILL radar site near Greeley, Colorado. (The vertical height scale is the same as that used in the thunderstorm case shown above. The color scale limits have been changed due to the narrower range of reflectivity values.)
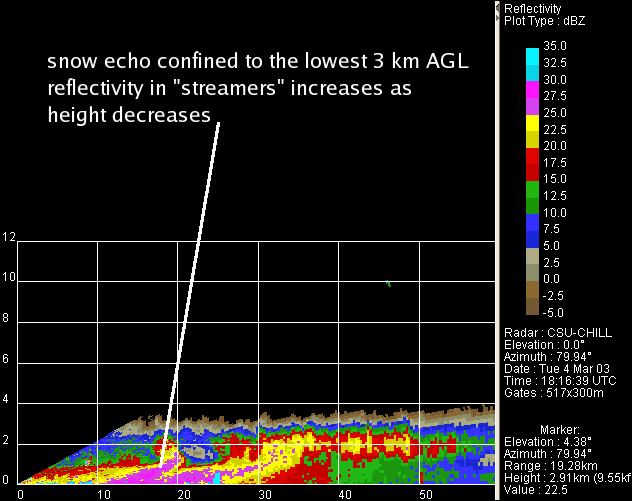
The "kinked" reflectivity profiles are due to the marked variation of the wind field in the vertical. Inbound (negative) radial velocities are found in the surface-based layer. (This "upslope" flow pattern is favorable for the development of precipitation in eastern Colorado). Above the surface layer, positive (outbound) radial velocities exist. The "snow streamers" become curved as the precipitation particles descend through this changing wind field. Due to these sloping trajectories, echo locations observed at longer radar ranges may not accurately indicate where the highest reflectivity areas are located at the surface.
