Boundary layer roll echoes observed on 22 July 2008: Difference between revisions
Pat kennedy (talk | contribs) |
m (Added external links, image centering, category) |
||
| Line 1: | Line 1: | ||
==Introduction== | ==Introduction== | ||
Once the sun’s radiation has sufficiently warmed the ground, convective updrafts develop in the planetary boundary layer. The general horizontal wind flow in the boundary layer can organize these updrafts into lines that are roughly parallel to the mean boundary layer wind direction. Compensating downdrafts are located between the updraft axes. Low level convergence into the updrafts acts to locally concentrate the ambient “clear air” scatterers (generally insects during the warm season) to the extent that radar-detectable banded echo lines develop. | Once the sun’s radiation has sufficiently warmed the ground, convective updrafts develop in the planetary boundary layer. The general horizontal wind flow in the boundary layer can organize these updrafts into lines that are roughly parallel to the mean boundary layer wind direction. Compensating downdrafts are located between the updraft axes. Low level convergence into the updrafts acts to locally concentrate the ambient “clear air” scatterers (generally insects during the warm season) to the extent that radar-detectable banded echo lines develop. A schematic of the boundary layer roll circulations can be found in Figure 1 of Weckwerth et al., MWR 1997, p 505-526. It should also be noted that in addition to the thermal buoyancy effects described above, the vertical shear of the horizontal wind can generate roll circulations. | ||
==Reflectivity PPI== | ==Reflectivity PPI== | ||
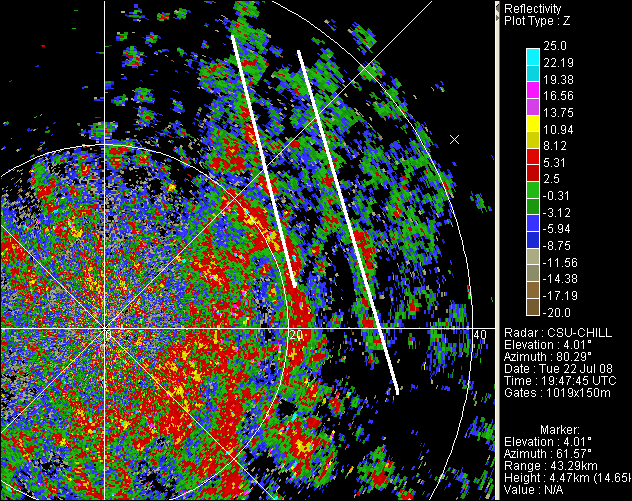
An example of this roll-related echo pattern can be seen in the CSU-CHILL radar data collected during the afternoon hours of 22 July 2008. | An example of this roll-related echo pattern can be seen in the CSU-CHILL radar data collected during the afternoon hours of 22 July 2008. This was warm day with fair weather cumulus clouds present in the afternoon. At 1947 UTC, the 4 degree elevation angle PPI reflectivity field contained several echo bands oriented in a south-southeast to north-northwest direction. | ||
<center> | |||
[[Image:Web pbl ppi z anot.png]] | [[Image:Web pbl ppi z anot.png]] | ||
</center> | |||
==Radial Velocity PPI== | ==Radial Velocity PPI== | ||
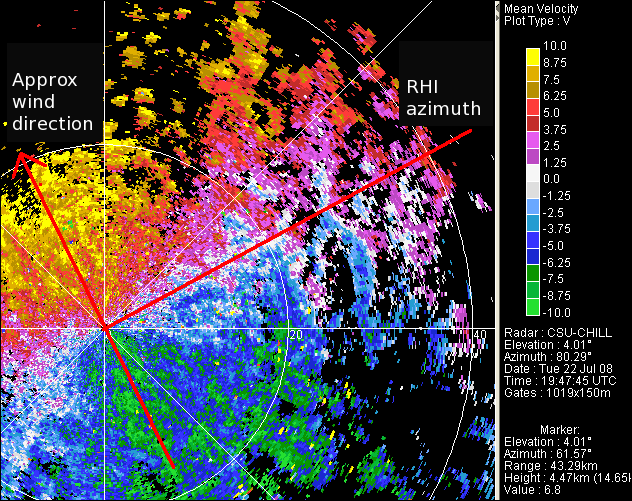
The corresponding radial velocity data indicates that these bands were generally aligned with the mean southeasterly horizontal wind flow. | The corresponding radial velocity data indicates that these bands were generally aligned with the mean southeasterly horizontal wind flow. | ||
<center> | |||
[[Image:Web pbl ppi v2 anot.png]] | [[Image:Web pbl ppi v2 anot.png]] | ||
</center> | |||
==Radial Velocity RHI== | ==Radial Velocity RHI== | ||
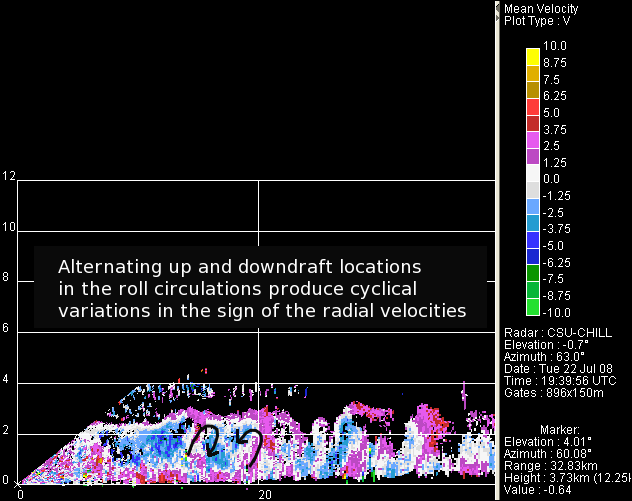
The following plot shows an RHI scan taken on an azimuth of | The following plot shows an RHI scan taken on an azimuth of 62° roughly perpendicular to the mean wind direction. This RHI plane orientation reduces the effects of the mean wind flow on the radial velocity field, making the flow patterns associated with the boundary layer roll circulations more evident. In this case, the vertical motions in the rolls were somewhat tilted, so their projections onto the radar beams in the RHI scan caused the sign of the radial velocities to vary cyclically with range. | ||
<center> | |||
[[Image:Web pbl rhi v2 anot.png]] | [[Image:Web pbl rhi v2 anot.png]] | ||
</center> | |||
==Reflectivity RHI== | ==Reflectivity RHI== | ||
The depth of the boundary layer echo was locally increased above the updraft branches of the underlying roll circulations. Under suitable mesoscale moisture and instability conditions, these boundary layer roll circulation updrafts can initiate the development thunderstorms. | The depth of the boundary layer echo was locally increased above the updraft branches of the underlying roll circulations. Under suitable mesoscale moisture and instability conditions, these boundary layer roll circulation updrafts can initiate the development thunderstorms. | ||
<center> | |||
[[Image:Web pbl rhi z2 anot.png]] | [[Image:Web pbl rhi z2 anot.png]] | ||
</center> | |||
==External Links== | |||
*[http://en.wikipedia.org/wiki/Planetary_boundary_layer About the Planetary Boundary Layer at Wikipedia] | |||
[[Category:Featured Articles]] | |||
Revision as of 00:04, 26 February 2009
Introduction
Once the sun’s radiation has sufficiently warmed the ground, convective updrafts develop in the planetary boundary layer. The general horizontal wind flow in the boundary layer can organize these updrafts into lines that are roughly parallel to the mean boundary layer wind direction. Compensating downdrafts are located between the updraft axes. Low level convergence into the updrafts acts to locally concentrate the ambient “clear air” scatterers (generally insects during the warm season) to the extent that radar-detectable banded echo lines develop. A schematic of the boundary layer roll circulations can be found in Figure 1 of Weckwerth et al., MWR 1997, p 505-526. It should also be noted that in addition to the thermal buoyancy effects described above, the vertical shear of the horizontal wind can generate roll circulations.
Reflectivity PPI
An example of this roll-related echo pattern can be seen in the CSU-CHILL radar data collected during the afternoon hours of 22 July 2008. This was warm day with fair weather cumulus clouds present in the afternoon. At 1947 UTC, the 4 degree elevation angle PPI reflectivity field contained several echo bands oriented in a south-southeast to north-northwest direction.
Radial Velocity PPI
The corresponding radial velocity data indicates that these bands were generally aligned with the mean southeasterly horizontal wind flow.
Radial Velocity RHI
The following plot shows an RHI scan taken on an azimuth of 62° roughly perpendicular to the mean wind direction. This RHI plane orientation reduces the effects of the mean wind flow on the radial velocity field, making the flow patterns associated with the boundary layer roll circulations more evident. In this case, the vertical motions in the rolls were somewhat tilted, so their projections onto the radar beams in the RHI scan caused the sign of the radial velocities to vary cyclically with range.
Reflectivity RHI
The depth of the boundary layer echo was locally increased above the updraft branches of the underlying roll circulations. Under suitable mesoscale moisture and instability conditions, these boundary layer roll circulation updrafts can initiate the development thunderstorms.


